EDR Telemetry: What Your Agent Is Really Telling You
Get more from any EDR platform understand process trees, memory events, and behavioral telemetry for better hunting.
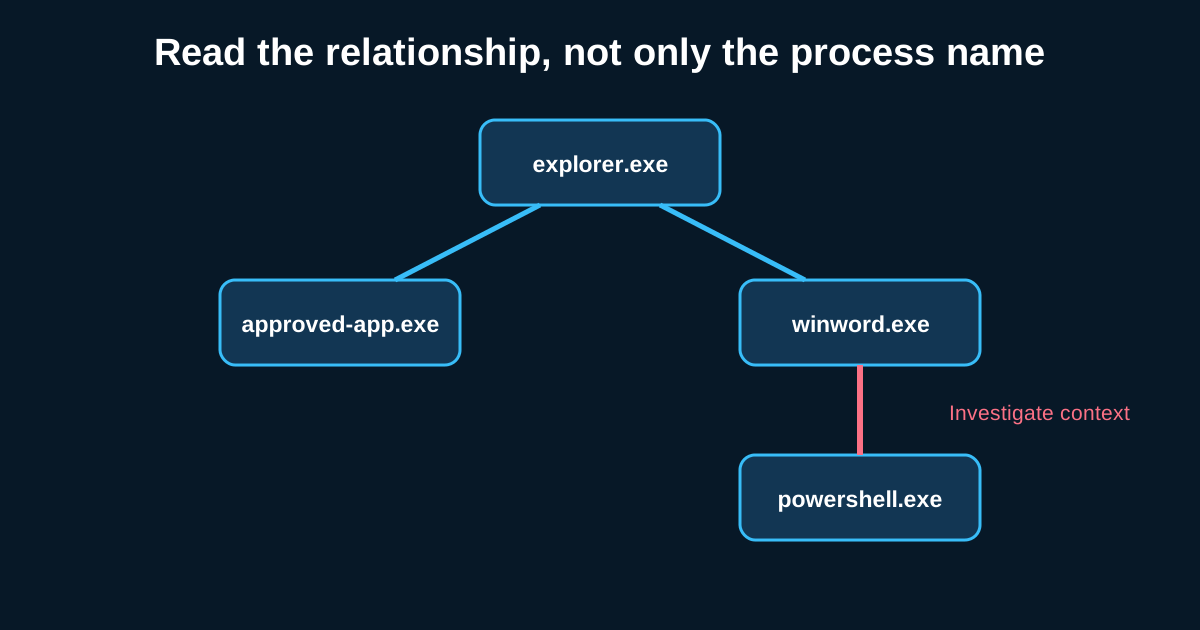
Every EDR vendor demo looks the same: a slick process tree lights up red, an analyst clicks through to a beautifully summarized verdict, everyone nods. Real hunting doesn’t work like that. The vendor’s own detection engine already caught the obvious stuff before you ever opened the console. What’s actually valuable for a hunter is the raw telemetry sitting underneath that polished alert—the data the agent collected that didn’t trigger anything, because that’s where the techniques nobody’s written a signature for yet are hiding.
I’ve worked across CrowdStrike, SentinelOne, Microsoft Defender for Endpoint, and a couple of smaller platforms over the years, and the underlying lesson is consistent regardless of vendor: the console’s alert feed is the least interesting part of the product for actual hunting.
Process lineage is the backbone, but depth of visibility varies wildly by vendor
Every EDR platform captures parent-child process relationships, but how deep that lineage goes and how reliably it survives process injection or hollowing techniques varies a lot. Some platforms track through several generations of process spawning cleanly; others lose fidelity once a process gets a few hops removed from the original execution, especially across process injection boundaries where the “parent” relationship gets murky by design.
Test this specifically in your own environment rather than trusting vendor marketing. Run a benign process injection proof-of-concept (there are safe, well-documented ones for exactly this purpose) and see how your specific EDR represents that lineage in its raw telemetry versus its summarized alert. Say your platform shows five generations of clean parent-child chain in the console UI but the underlying raw event data only actually captures three of those hops reliably—that’s exactly the kind of platform-specific limitation that should shape how much you trust process tree visualizations during an investigation versus how much you go digging in raw events yourself.
Memory-level telemetry is where the most advanced techniques actually get caught
Command-line and process telemetry catches a lot, but memory-resident techniques—reflective DLL injection, process hollowing, direct syscall usage to bypass userland hooking—often don’t show up cleanly in process or file event streams at all. This is where memory scanning telemetry, however your specific EDR platform exposes it (some show it as discrete “suspicious memory region” events, others bury it inside a broader behavioral score), becomes the differentiator between catching an advanced technique and missing it entirely.
The honest caveat here: this telemetry is noisier and harder to hunt with confidently than process or network data. A lot of legitimate software does things that superficially resemble memory injection techniques—some anti-cheat systems, some legitimate remote access tools, certain licensing check mechanisms. Expect to spend real tuning time here, and expect a higher false-positive tolerance than you’d accept for process-based hunts.
Kernel callback data versus userland hooking—know which your agent uses
This is a technical distinction worth understanding because it affects what your EDR can and can’t see. Agents that hook primarily at the userland API level (inline hooking of functions like NtCreateFile) can be blinded or bypassed by techniques that call the underlying syscalls directly, skipping the hooked layer entirely. Agents that rely more heavily on kernel-level callbacks (via a minifilter driver or ETW-based telemetry) tend to have better resilience against direct syscall techniques, though they’re not immune either—nothing is.
Knowing which approach your specific platform leans on changes how you think about coverage gaps. If you know your agent is more userland-hook-dependent, that’s a specific reason to weight your hunting more heavily toward network and file-system artifacts as a compensating control, rather than assuming process telemetry alone has you covered against every technique.
Behavioral scoring is a starting point for investigation, not a verdict
Most EDR platforms attach some kind of behavioral or risk score to processes and hosts, aggregating multiple weak signals into one number. This is genuinely useful as a triage aid—sorting your investigation queue by score is more efficient than reviewing events chronologically with no prioritization at all. But treating a mid-range score as “probably fine” is a mistake. Plenty of genuinely malicious activity scores moderately rather than critically, specifically because it’s designed to avoid tripping the loudest thresholds.
The analysis discipline that actually works: use the score to prioritize your queue, but don’t let it substitute for actually reading the underlying events on anything you’ve decided to investigate. A 40-out-of-100 score with a process injection event and an unusual outbound connection sitting in the raw telemetry deserves the same depth of investigation as a 95, if those two data points line up with a hypothesis you’re actively testing.
Getting more out of the platform you already have
You don’t necessarily need a better EDR platform to hunt better—you need to actually use the raw telemetry your current platform already collects instead of living entirely inside its alert feed. Most vendors expose a query interface or raw event export specifically for this purpose, and most hunt teams under-use it relative to how much data is actually sitting there unexamined.