Phase 7 Capstone - Network Intrusion From PCAP
A full network-based intrusion investigation, working entirely from packet capture the capstone that tests real analytical judgment.
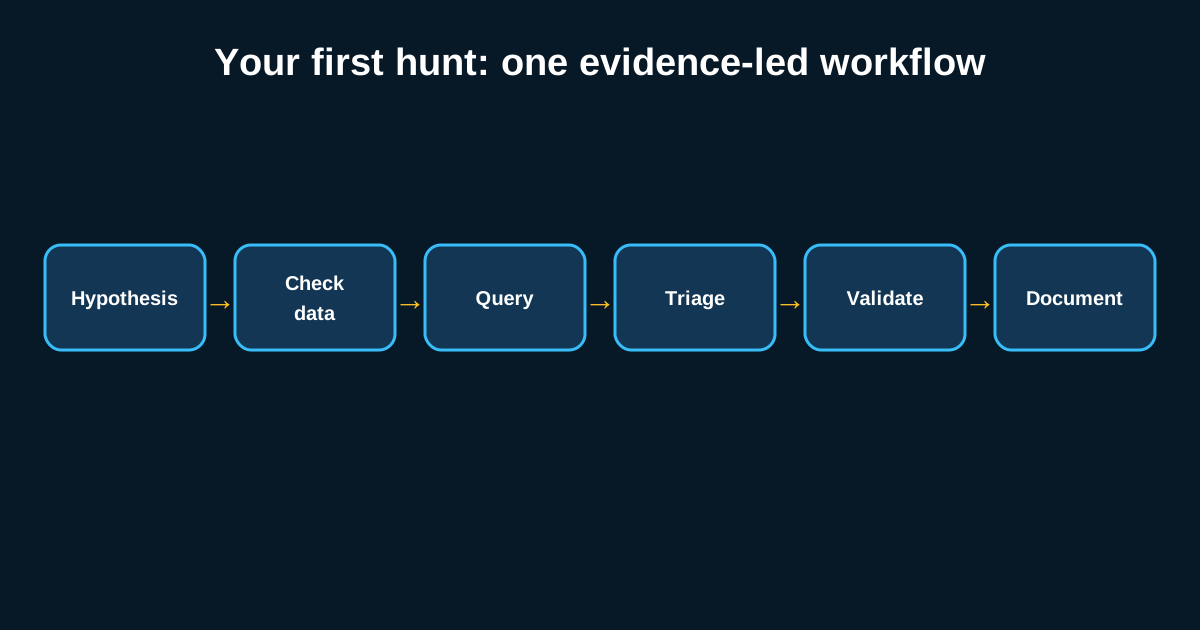
Handed a raw PCAP file and told “something happened in here, figure out what,” most people freeze for a minute. That reaction is normal, and it’s also exactly the moment this capstone is designed to push through. Reading individual protocol fields in isolation is one skill. Reconstructing an entire intrusion narrative from nothing but captured packets, under time pressure, with no hints about where to start, is a completely different one and it’s the one that actually matters when an incident lands on your desk without a helpful summary attached.
This exercise mirrors what a genuine network forensics engagement looks like more closely than almost anything else in a hunting curriculum, precisely because nobody hands you a starting point. You have to find one yourself.
Triage before deep analysis, every single time
The instinct to open the PCAP in Wireshark and start scrolling packet by packet is understandable and almost always the wrong first move on a capture of any real size. A file covering even a few hours of moderate traffic can run into hundreds of thousands of packets, and manually reviewing that is a good way to spend six hours finding nothing useful.
Start with protocol statistics and conversation summaries instead Wireshark’s Statistics menu, or command-line tools like tshark piped into sort | uniq -c for a quick conversation breakdown, gives you a bird’s-eye view of who’s talking to whom, how much, and over what protocols. This is where you spot the host generating way more DNS queries than anything else in the capture, or the single external IP receiving traffic from six different internal hosts when nothing else in the environment shows that pattern. That’s your entry point. Everything else builds from there.
Follow the anomaly, not your assumptions about what “should” be there
A common mistake in this kind of exercise is going in with a preconceived idea of what the intrusion looks like assuming it must be a phishing-delivered payload, say and then interpreting ambiguous evidence to fit that assumption rather than following where the actual data points. Realistic capstone scenarios are built to punish that instinct specifically, sometimes by including a genuine red herring alongside the real intrusion path.
Once triage flags a candidate anomaly, follow the conversation stream directly. Wireshark’s “Follow TCP Stream” feature reconstructs the full exchange for a given connection, and for unencrypted protocols this can hand you the actual payload an HTTP request revealing a webshell command, an FTP session showing files being pulled off a compromised host, that kind of thing. For encrypted traffic, this is where the TLS metadata analysis skills JA3, certificate details, SNI come back into play, since you won’t get payload content but you’ll still get plenty to work with.
Reconstructing the timeline requires discipline, not just tool skill
The actual deliverable of a network intrusion investigation isn’t a list of suspicious packets it’s a coherent narrative with a timeline: initial contact, what got delivered, what happened next, and how far it went. Building that requires cross-referencing timestamps across multiple conversation threads in the same capture, which is tedious but is genuinely where the investigative skill lives.
A realistic scenario might reveal an initial exploitation attempt against a vulnerable service at one timestamp, followed forty minutes later by a new outbound connection from that same host establishing what looks like a C2 channel, followed by a burst of internal scanning traffic from that host two hours after that. Each of those findings individually is a data point. Ordered correctly and tied together, they tell you the full story how the attacker got in, what they did immediately after, and whether they started moving laterally. Getting the order wrong, or missing that all three events trace back to the same source host, produces a report that technically isn’t false but is functionally useless to whoever has to act on it.
Distinguishing exploitation from reconnaissance from actual compromise
Not every anomalous packet in a capture represents a successful attack, and a realistic scenario should include failed attempts alongside successful ones an exploit attempt against a patched service that clearly didn’t work, scan traffic that got blocked at a firewall, that sort of thing. Part of the investigative skill being tested is correctly identifying which anomalies represent genuine compromise versus which represent attempts that simply didn’t succeed, and being honest in your findings about the difference rather than treating every suspicious packet as equally significant.
This distinction matters enormously for the eventual report. Confusing a blocked exploitation attempt with a successful one either understates real risk or, just as commonly in these exercises, sends incident response chasing a compromise that never actually happened while a smaller, quieter, genuinely successful intrusion sits unaddressed elsewhere in the same capture.
Delivering findings that stand on their own
As with the endpoint capstone, the write-up is part of the exercise, not an afterthought tacked onto the end. A network intrusion report needs specific IPs, specific timestamps, specific protocol details, and a clear statement of what’s confirmed versus what’s inferred versus what remains genuinely unknown from the available capture. Overstating confidence in an ambiguous finding is a mistake that shows up constantly in first attempts at this kind of exercise, and it’s worth catching in a training environment rather than in a report that ends up in front of a client or an executive team.