Wireshark for Threat Hunters
Zeek and Suricata narrow it down Wireshark is where you confirm it. Practical PCAP analysis techniques for threat hunting investigations.
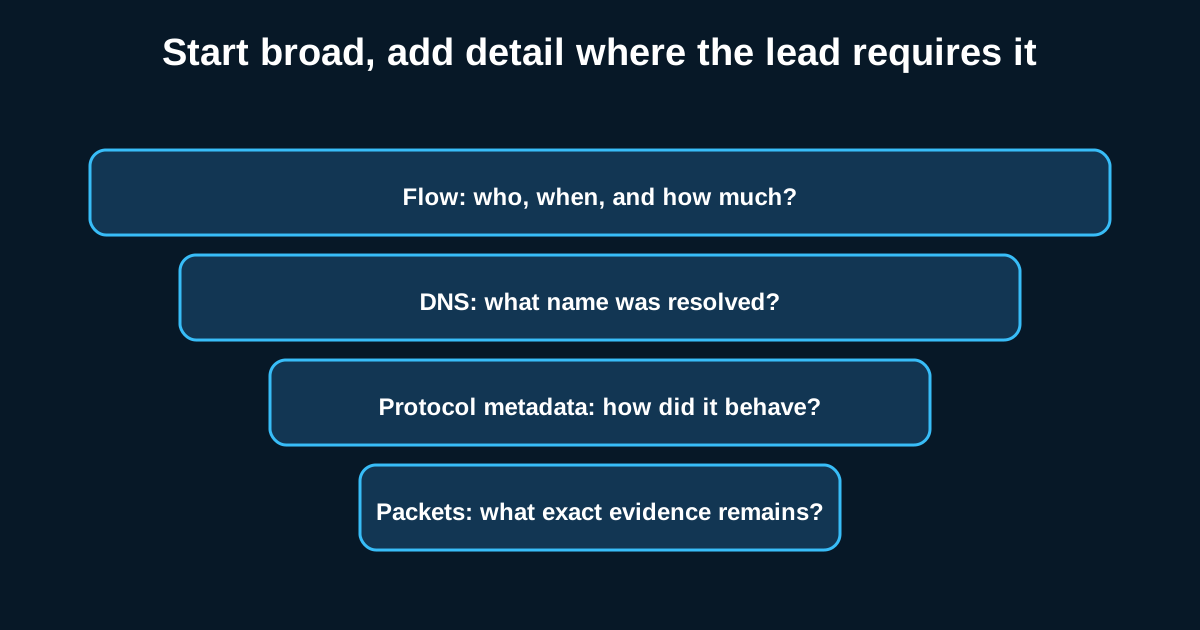
Every hunter eventually hits the moment where the metadata says “something’s wrong here” and you need to actually look at the bytes. That’s when Wireshark comes out. It’s not a hunting tool in the sense that Zeek or Suricata are—you’re not running it across your whole environment continuously—but it’s the tool you reach for once a hunt has narrowed down to a specific session, host, or timeframe and you need ground truth.
I still see analysts open Wireshark, stare at the packet list scrolling by, and just… scroll. That’s not analysis, that’s sightseeing. Good PCAP work in a hunting context is targeted and hypothesis-driven, same as any other part of the process.
Filters Aren’t Optional—They’re the Whole Job
If you’re not writing display filters, you’re not really doing PCAP analysis, you’re doing PCAP browsing. Learn the filter syntax properly. tcp.flags.syn==1 && tcp.flags.ack==0 for isolating connection attempts. http.request.method=="POST" && http.content_length > 10000 for spotting large outbound POSTs that might be exfil. tls.handshake.extensions_server_name contains "xyz" for chasing a specific domain across a capture with thousands of sessions.
A technique that saves real time: build filter chains progressively. Start broad (isolate the suspect IP with ip.addr==203.0.113.44), then narrow by protocol, then narrow again by specific fields once you understand the shape of the traffic. Trying to write the perfect filter in one shot usually means missing something because you assumed the traffic pattern before actually looking at it.
Follow TCP Stream Is Underrated for a Reason
The “Follow TCP Stream” feature gets used constantly by beginners and, honestly, not enough by seasoned analysts once they get comfortable with filters. It’s still one of the fastest ways to understand what actually happened in a session—reconstructed, in order, readable.
Say you’ve isolated a suspicious HTTP session via filters. Following the stream shows you the full request and response, headers included, in the order they were actually exchanged. I’ve caught command injection attempts in URL parameters this way that would’ve taken much longer to piece together field-by-field from the packet list. For a session moving maybe 200KB across 40 packets, following the stream takes about ten seconds and gives you the whole narrative at once.
Statistics Menu—The Part Everyone Skips
Wireshark’s Statistics menu (Protocol Hierarchy, Conversations, Endpoints, IO Graph) gets ignored by a lot of analysts who go straight to filtering, but it’s genuinely one of the fastest ways to orient yourself in an unfamiliar capture.
Protocol Hierarchy tells you, at a glance, what’s actually in this PCAP—if you’re expecting mostly HTTP/HTTPS traffic and Protocol Hierarchy shows a chunk of raw TCP with no identified application protocol, that’s immediately worth investigating; unidentified protocol traffic is a common signature of custom C2 channels that don’t speak standard protocols.
IO Graph is great for spotting beaconing visually before you even build a filter for it—regular, evenly-spaced spikes in traffic volume over time jump out on the graph in a way they don’t when you’re scanning a packet list. I generally check IO Graph within the first two minutes of opening a capture I didn’t collect myself, just to get a shape of what I’m dealing with.
Extracting Objects—Don’t Just Look, Pull the Artifact
File > Export Objects works across HTTP, SMB, TFTP, and IMF (email) and lets you pull actual files that crossed the wire during the capture window—executables, documents, images, whatever. This matters because sometimes the most useful thing in a PCAP isn’t the traffic pattern, it’s an actual malware sample or malicious document that got delivered during the session.
Pull it, hash it, and run that hash against your threat intel sources or a sandbox before doing anything else with it. I’ve seen analysts spend an hour analyzing traffic patterns around a file transfer when the file itself, extracted and hashed, would’ve answered the question in thirty seconds by matching a known malware family.
Know When Wireshark Isn’t the Right Tool
Here’s the caveat I give every junior analyst: Wireshark doesn’t scale. It’s built for deep analysis of a specific, bounded capture—not for continuous monitoring across your environment. If you find yourself trying to hunt across gigabytes of daily traffic in Wireshark directly, you’ve skipped the metadata-narrowing step that Zeek or Suricata should have done first. Use Wireshark for confirmation and deep-dive, not discovery at scale. Trying to make it do both just burns analyst time you don’t get back.
The best hunters I’ve worked with treat Wireshark as the last step in a chain—metadata tools point you at something, Wireshark tells you exactly what happened. Skip either half of that chain and you’re either drowning in noise or missing the ground truth.